This article guides you on how to perform RFM analysis for customer segmentation in Power BI. This analysis segments customers based on their purchasing behavior by assigning scores for the recency of their last purchase, the frequency of their purchases, and their total spending.

Kindly note that this article will not provide a detailed guide on dashboard construction, as this dashboard is a component of a comprehensive Superstore performance dashboard currently under development. A dedicated tutorial will be shared exclusively in the near future.
Defining RFM Analysis
RFM analysis is a customer segmentation technique that helps businesses understand and categorize customers based on their Recency, Frequency, and Monetary Value.
- Recency (R): How recently a customer made a purchase. Customers who have made recent purchases are more likely to respond to promotions.
- Frequency (F): How often a customer makes purchases. Customers who make frequent purchases are more engaged and loyal.
- Monetary (M): How much money a customer spends. Customers who spend more money are more valuable.
Benefits of RFM Analysis:
- Improved Customer Segmentation: RFM analysis helps businesses identify different customer groups based on their behavior.
- Targeted Marketing: Businesses can create more effective marketing campaigns by targeting specific customer segments.
- Enhanced Customer Retention: By understanding customer behavior, businesses can implement strategies to retain valuable customers.
- Increased Revenue: RFM analysis can lead to increased revenue by identifying opportunities to upsell, cross-sell, and improve customer lifetime value.
The following table displays RFM Score segmentation as defined by Bloomreach:
| Customer Segment | Description | RFM Scores |
| Champions | These are your best customers. They buy most recently, most frequently, and spend the most. They are highly valuable and loyal. | 555, 554, 544, 545, 454, 455, 445 |
| Loyal | These customers buy frequently and spend a good amount. They are reliable and contribute significantly to your revenue. | 543, 444, 435, 355, 354, 345, 344, 335 |
| Potential Loyalist | These are recent customers with good spending habits. They have the potential to become loyal customers with the right nurturing. | 553, 551, 552, 541, 542, 533, 532, 531, 452, 451, 442, 441, 431, 453, 433, 432, 423, 353, 352, 351, 342, 341, 333, 323 |
| New Customers | These are customers who have made their first purchase recently. Their future value is yet to be determined, so nurturing them is important. | 512, 511, 422, 421, 412, 411, 311 |
| Promising | These customers show potential, with decent recency, frequency, and monetary values. They could be developed into more valuable customers. | 525, 524, 523, 522, 521, 515, 514, 513, 425, 424, 413, 414, 415, 315, 314, 313 |
| Need Attention | These customers have spent a good amount in the past but haven’t purchased recently. They need re-engagement to prevent them from slipping away. | 535, 534, 443, 434, 343, 334, 325, 324 |
| About to Sleep | These customers have lower recency, frequency, and monetary values. They are at risk of becoming inactive. | 331, 321, 312, 221, 213, 231, 241, 251 |
| Cannot Lose Them but Losing | These are customers that were very valuable, but are showing strong signs of churn. They require immediate action to retain. | 155, 154, 144, 214, 215, 115, 114, 113 |
| At Risk | These customers haven’t purchased recently and show declining frequency and monetary values. They are in danger of becoming lost. | 255, 254, 245, 244, 253, 252, 243, 242, 235, 234, 225, 224, 153, 152, 145, 143, 142, 135, 134, 133, 125, 124 |
| Hibernating Customers | These customers haven’t made a purchase in a long time. They are inactive and require significant effort to re-engage. | 332, 322, 233, 232, 223, 222, 132, 123, 122, 212, 211 |
| Lost Customers | These customers are no longer active and are unlikely to return. They represent lost revenue. | 111, 112, 121, 131, 141, 151 |
Source: https://documentation.bloomreach.com/engagement/docs/rfm-segmentation
About the Case Study
To conduct RFM analysis, we will use a sample dataset from Superstore. In this case study, we want to segment customers based on their buying behavior, which can be determined by understanding three key aspects: their most recent purchases since the reference date (recency), how frequently they order from the store (frequency), and how much money they have spent (monetary).
Step 1: Creating a Summary Table of Customer Transactions
The data required to calculate Recency (R), Frequency (F), and Monetary (M) scores is already available. As a first step, we will summarize all transaction data for each customer, as individual customers may have multiple transactions. We will then create a new table by extracting and calculating the necessary information for RFM scoring, including Customer ID, Customer Name, Last Order Date, Total Sales (representing total customer spending), Order Frequency, and Total Items Ordered. This will be achieved by defining the following DAX measure:
Table_RFM Analysis =
    SUMMARIZE(
        'Sample - Superstore_Orders',
        'Sample - Superstore_Orders'[Customer ID],
        'Sample - Superstore_Orders'[Customer Name],
        "Last Order Date", MAX('Sample - Superstore_Orders'[Order Date]),
        "Total Spending", SUM('Sample - Superstore_Orders'[Sales]),
        "Order Frequency", DISTINCTCOUNT('Sample - Superstore_Orders'[Order ID]),
        "Total Items Ordered", SUM('Sample - Superstore_Orders'[Quantity])
    )
Once the table is generated, we will need to add an additional column to calculate the recency in days. Recency is calculated by determining the date difference between the customer’s last order date and a defined reference date. In this particular case study, the reference date is set to the last day of 2020 because the most recent order date in the dataset is from that year. Generate a calculated column using the following DAX measure:
Recency (days) =
DATEDIFF('Table_RFM Analysis'[Last Order Date], DATE(2020, 12, 31), DAY)
Note: You can choose the reference date based on your preference. For example, with a constantly updated dataset, you can use the TODAY() function to calculate recency as the difference between the last order date and today’s date, rather than a fixed date.
Recency (days) =
DATEDIFF('Table_RFM Analysis'[Last Order Date], TODAY(), DAY)
Step 2: Calculating the Recency (R), Frequency (F), and Monetary (M) Scores
The RFM model assigns a score of 1 to 5 (from worst to best) for customers in each of the three categories.
Step 2.1: Calculating the Recency Score (R)
Recency indicates how recently a customer made a purchase, reflecting their current engagement and potential interest. Customers with recent purchases are more likely to respond to marketing efforts and promotions. The recency score will be assigned based on the ‘Recency (days)’ column. A larger number of days indicates that the customer hasn’t ordered from the store in a longer time. Conversely, a smaller number of days signifies a more recent purchase, suggesting higher engagement. Following this logic, we will assign a recency score from 1 to 5 by dividing the ‘Recency (days)’ values into five bins. A score of 1 will represent the largest number of days (customers who haven’t ordered in a long time), while a score of 5 will represent the smallest number of days (customers who purchase most recently).
To segment the recency values (which range from 1 to 1,166 days) into five groups, we will create a calculated column with the following DAX measure:
Recency Score (R) =
SWITCH(
    TRUE(),
    'Table_RFM Analysis'[Recency (days)] <= 200, 5,
    'Table_RFM Analysis'[Recency (days)] <= 400, 4,
    'Table_RFM Analysis'[Recency (days)] <= 600, 3,
    'Table_RFM Analysis'[Recency (days)] <= 800, 2,
    'Table_RFM Analysis'[Recency (days)] > 800, 1
)
Step 2.2: Calculating the Frequency Score (R)
Next, we will calculate the frequency score based on customer order frequency. Similar to the recency scoring, we will assign a score of 1 to 5 to the ‘Order Frequency’ column, where the highest frequency receives a score of 5 and the lowest frequency receives a score of 1. Before defining the DAX measure, we need to check the range of values in this column. Once we know the range (1 to 17), we will divide it into 5 bins by creating a new calculated column using the following DAX measure:
Frequency Score (F) =
SWITCH(
    TRUE(),
    'Table_RFM Analysis'[Order Frequency] <= 3, 1,
    'Table_RFM Analysis'[Order Frequency] <= 6, 2,
    'Table_RFM Analysis'[Order Frequency] <= 9, 3,
    'Table_RFM Analysis'[Order Frequency] <= 12, 4,
    'Table_RFM Analysis'[Order Frequency] > 12, 5
)
Step 2.3: Calculating the Monetary Score (M)
The monetary score will be assigned to the ‘Total Spending’ column, which represents the total amount spent by each customer across all their orders. Customers with higher total spending will receive a higher monetary score, and those with lower total spending will receive a lower score.
Following the same approach as with recency and frequency, we will divide the ‘Total Spending’ values into 5 bins to assign the monetary scores by creating a new calculated column using the following DAX measure:
Monetary Score (M) =
SWITCH(
    TRUE(),
    'Table_RFM Analysis'[Total Sales] <= 5000, 1,
    'Table_RFM Analysis'[Total Sales]  <= 10000, 2,
    'Table_RFM Analysis'[Total Sales]  <= 15000, 3,
    'Table_RFM Analysis'[Total Sales]  <= 20000, 4,
    'Table_RFM Analysis'[Total Sales]  > 20000, 5
)
Step 2.4: Combining the Scores
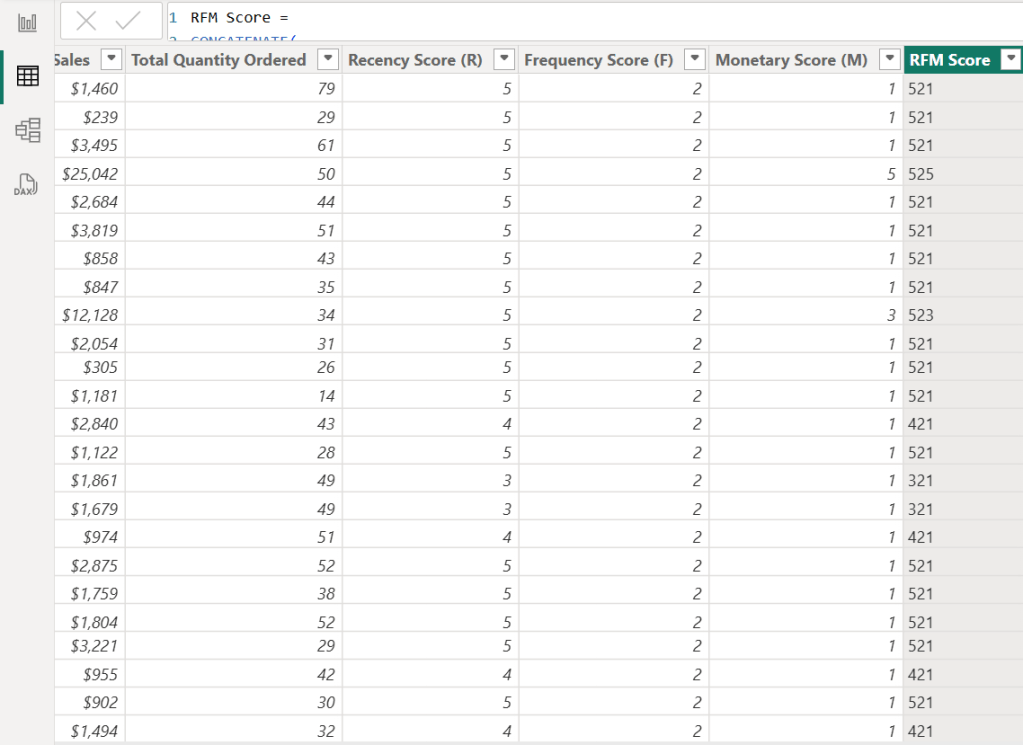
After calculating the RFM scores, we will combine the values from these three categories in one column to make it a 3-digits string
RFM Score =
CONCATENATE(
    CONCATENATE( 'Table_RFM Analysis'[Recency Score (R)], 'Table_RFM Analysis'[Frequency Score (F)] ),
    'Table_RFM Analysis'[Monetary Score (M)]
)
Step 2.5: Defining Customer Segments Using RFM Scores
While various sources offer RFM-based customer segmentation with differing criteria, this case study will adopt the framework provided by Bloomreach (referenced in the introduction). We will implement this framework by creating a calculated column using the following DAX measure to assign RFM segments.
Note that the ‘Losing but Engaged’ segment will be omitted, as it shares identical criteria with the ‘Lost Customers’ segment within this specific model.
Customer Segment =
VAR RFM = 'Table_RFM Analysis'[RFM Score]
RETURN
SWITCH(
    TRUE(),
    RFM IN { "555", "554", "544", "545", "454", "455", "445" }, "Champions",
    RFM IN { "543", "444", "435", "355", "354", "345", "344", "335" }, "Loyal",
    RFM IN { "553", "551", "552", "541", "542", "533", "532", "531", "452", "451", "442", "441", "431", "453", "433", "432", "423", "353", "352", "351", "342", "341", "333", "323" }, "Potential Loyalist",
    RFM IN { "512", "511", "422", "421", "412", "411", "311" }, "New Customers",
    RFM IN { "525", "524", "523", "522", "521", "515", "514", "513", "425", "424", "413", "414", "415", "315", "314", "313" }, "Promising",
    RFM IN { "535", "534", "443", "434", "343", "334", "325", "324" }, "Need Attention",
    RFM IN { "331", "321", "312", "221", "213", "231", "241", "251" }, "About to Sleep",
    RFM IN { "155", "154", "144", "214", "215", "115", "114", "113" }, "Cannot Lose Them but Losing",
    RFM IN { "255", "254", "245", "244", "253", "252", "243", "242", "235", "234", "225", "224", "153", "152", "145", "143", "142", "135", "134", "133", "125", "124" }, "At Risk",
    RFM IN { "332", "322", "233", "232", "223", "222", "132", "123", "122", "212", "211" }, "Hibernating Customers",
    RFM IN { "111", "112", "121", "131", "141", "151" }, "Lost Customers",
    "Other"
)
Step 3: Analyzing the Customer Segments
After defining customer segments, we will employ data visualization techniques to analyze each group comprehensively. This visualization will enable stakeholders to develop targeted strategies, enhance services, and address specific customer needs, ultimately driving customer loyalty and business growth.
This dashboard provides insights into the Superstore’s customer base through RFM segmentation. It identifies eight key segments: Loyal, Potential Loyalist, New Customers, Promising, Need Attention, About to Sleep, Hibernating Customers, and Lost Customers. The dashboard features a total customer KPI card, a tree map visualizing segment size, and small multiple KPI cards that reveal each segment’s proportional size and performance metrics such as total customers, order frequency, and total spending.

Potential Loyalists represent the largest segment of Superstore’s customers at 43.9%, followed by Promising (30.3%) and New Customers (16.5%). With Loyal Customers comprising only 0.9%, a key focus should be nurturing Potential Loyalists – recent, decent-spending customers who need encouragement for repeat purchases – into becoming loyal. This can be achieved through various marketing initiatives such as loyalty programs, personalized recommendations, targeted discounts, superior customer service, and engagement across multiple channels.
To nurture Promising Customers—those showing potential through engagement, spending, or interest but not yet loyal—the focus should be on deepening their connection, driving more frequent and higher-value purchases, and solidifying their loyalty. Key strategies include personalized communication based on their behavior, exclusive offers and rewards, providing valuable content and education, building a sense of community, and proactive engagement.
New Customers, defined by their recent purchase, require nurturing to cultivate loyalty. In these early stages of the customer relationship, the aim is to make a positive initial impact, establish trust, and incentivize repeat purchases. This can be achieved through personalized welcomes, effective onboarding processes, highlighting value and benefits, encouraging interaction and feedback, and offering exclusive incentives for their next purchase.
Additionally, the ‘About to Sleep’ segment, representing 5% of total customers, is a critical group to monitor as they are at risk of transitioning into Hibernating and ultimately Lost Customers.
Note: Due to a current Power BI bug affecting conditional formatting on small multiple cards, I have not highlighted the variance between actual and previous year.
Thank you for reading!
I hope this case study provided valuable insights and sparked your interest. Please feel free to connect with me on LinkedIn or via email if you have any questions or would like to discuss this further.

Leave a comment