This article provides a guide on marking the earliest and latest selected years on a line chart and visualizing growth over time with reference lines.

Foreword
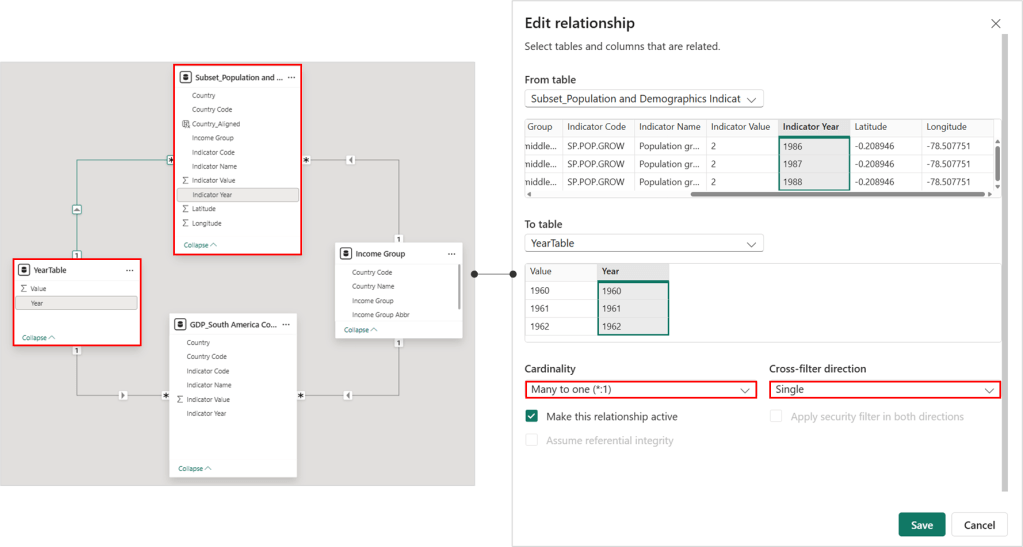
Using World Bank Open Data on South American population, this case study dynamically displays urban and total population growth for the earliest and latest selected years on a line chart, with growth indicators positioned using connector lines.
Step 1: Creating Year Table and DAX Measures for the Line Chart
A line chart will illustrate the annual trend of average total and urban population growth in South America. We will begin by generating a year table and connecting it to the main data table.
Table #01: [YearTable]
YearTable = ADDCOLUMNS(
    GENERATESERIES(1960, 2023, 1),
    "Year", [Value]
)
Next, we will create two DAX measures: one for average total population growth (%) and one for average urban population growth (%).
Measure #01: [_01 Total Population Growth (Annual %)]
_01 Total Population Growth (Annual %) =
CALCULATE(
    AVERAGE('Subset_Population and Demographics Indicators'[Indicator Value]),
    'Subset_Population and Demographics Indicators'[Indicator Name] = "Population growth (annual %)"
)
Measure #02: [_02 Urban Population Growth (Annual %)]
_02 Urban Population Growth (Annual %) =
CALCULATE(
    AVERAGE('Subset_Population and Demographics Indicators'[Indicator Value]),
    'Subset_Population and Demographics Indicators'[Indicator Name] = "Urban population growth (annual %)"
)
Step 2.1: Setting Up the Line Chart Axis

After preparing the necessary year table and DAX measures, place the year column on the x-axis of the line chart and both average urban population growth and average total population growth on the y-axis. Configure the x-axis as “continuous” to display years selectively for a cleaner appearance. Set the x-axis range from 1960 to 2023 to match the data period. For the y-axis, use 0 as the minimum value, and set the maximum value to the highest average urban population growth multiplied by a factor to create sufficient space for data labels.
Measure #03: [_03 Max_Urban Population Growth (Annual %)]
_03 Max_Urban Population Growth (Annual %) =
MAXX(
    ALL(YearTable[Year]),
    [_02 Urban Population Growth (Annual %)]
)
Measure #04: [_04 Y-Axis Max]
_04 Y-Axis Max = [_03 Max_Urban Population Growth (Annual %)] * 1.3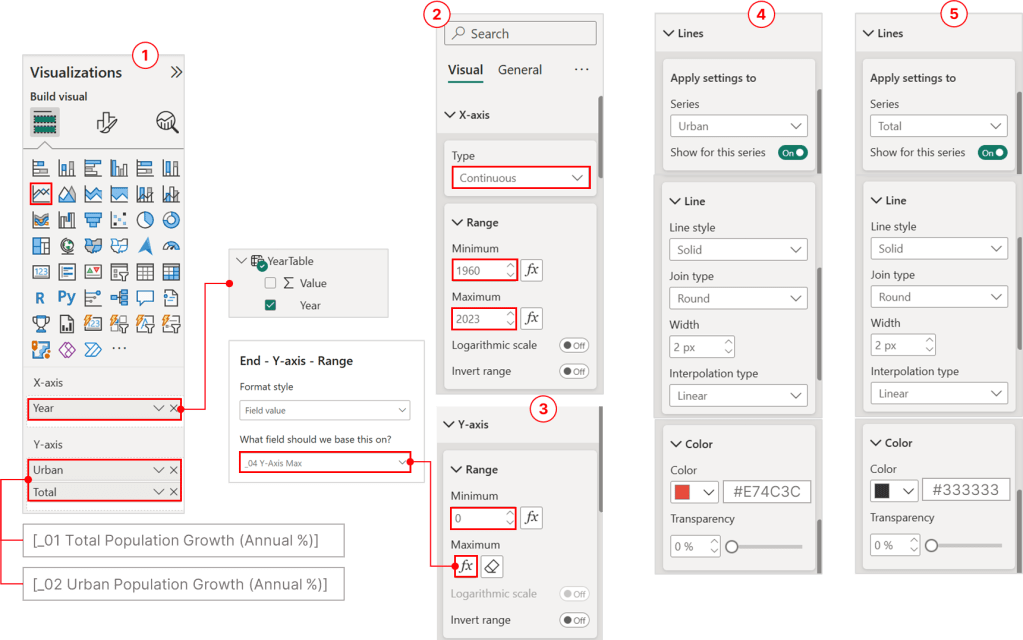
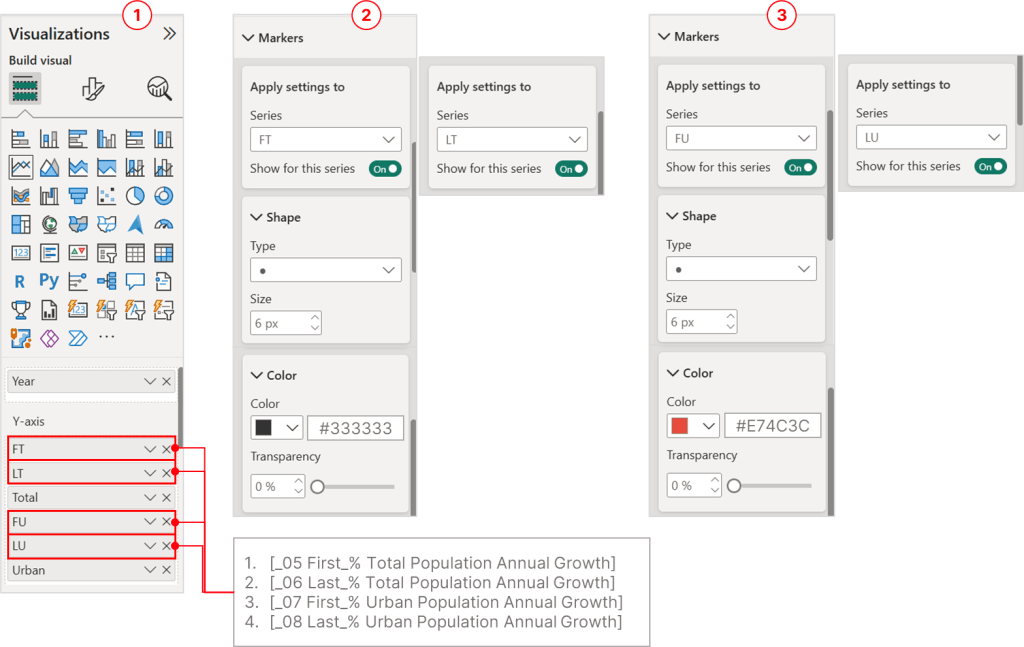
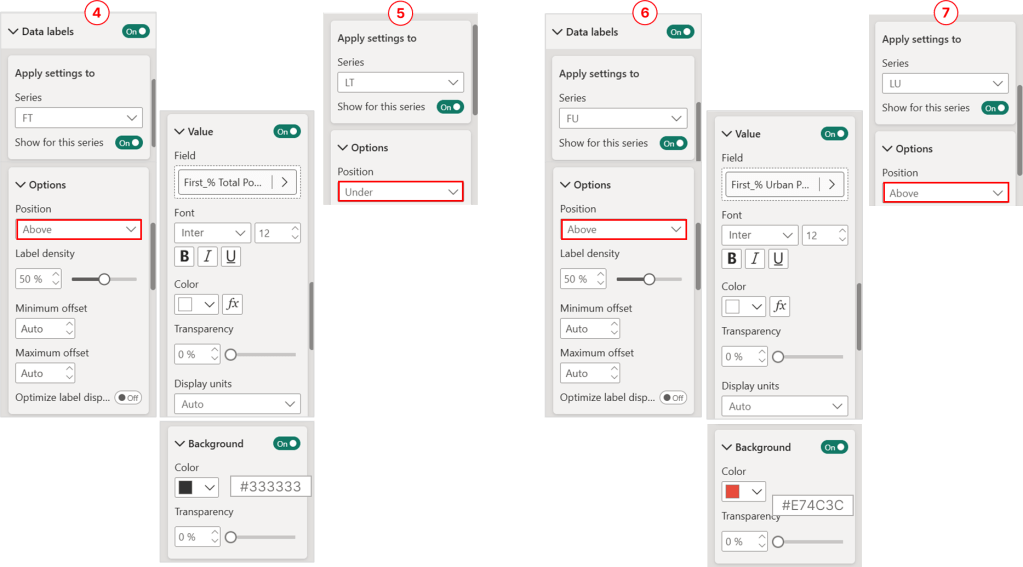
Step 2.2: Showing Values for Earliest and Latest Years
Next, we will create DAX measures to identify the earliest and latest years for both total and urban population annual growth. These measures will be displayed as markers on the line chart.
Measure #05: [_05 First_% Total Population Annual Growth]
_05 First_% Total Population Annual Growth =
VAR FirstNonBlankYear =
    CALCULATE(
        MIN(YearTable[Year]),
        FILTER(
            ALLSELECTED(YearTable[Year]),  // Ensure it respects the slicer selection
            NOT(ISBLANK([_01 Total Population Growth (Annual %)]))
        )
    )

VAR Result =
    IF(
        SELECTEDVALUE(YearTable[Year]) = FirstNonBlankYear,
        [_01 Total Population Growth (Annual %)]
    )

RETURN
    Result
Measure #06: [_06 Last_% Total Population Annual Growth]
_06 Last_% Total Population Annual Growth =
VAR LastNonBlankYear =
    CALCULATE(
        MAX(YearTable[Year]),
        FILTER(
            ALLSELECTED(YearTable[Year]),  // Ensure it respects the slicer selection
            NOT(ISBLANK([_01 Total Population Growth (Annual %)]))
        )
    )

VAR Result =
    IF(
        SELECTEDVALUE(YearTable[Year]) = LastNonBlankYear,
        [_01 Total Population Growth (Annual %)]
    )

RETURN
    Result
Measure #07: [_07 First_% Urban Population Annual Growth]
_07 First_% Urban Population Annual Growth =
VAR FirstNonBlankYear =
    CALCULATE(
        MIN(YearTable[Year]),
        FILTER(
            ALLSELECTED(YearTable[Year]),  // Ensure it respects the slicer selection
            NOT(ISBLANK([_02 Urban Population Growth (Annual %)]))
        )
    )

VAR Result =
    IF(
        SELECTEDVALUE(YearTable[Year]) = FirstNonBlankYear,
        [_02 Urban Population Growth (Annual %)]
    )

RETURN
    Result
Measure #08: [_08 Last_% Urban Population Annual Growth]
_08 Last_% Urban Population Annual Growth =
VAR LastNonBlankYear =
    CALCULATE(
        MAX(YearTable[Year]),
        FILTER(
            ALLSELECTED(YearTable[Year]),  // Ensure it respects the slicer selection
            NOT(ISBLANK([_02 Urban Population Growth (Annual %)]))
        )
    )

VAR Result =
    IF(
        SELECTEDVALUE(YearTable[Year]) = LastNonBlankYear,
        [_02 Urban Population Growth (Annual %)]
    )

RETURN
    Result
Place all these measures on the y-axis, displaying only the markers and data labels while hiding the lines and series labels, as illustrated below:
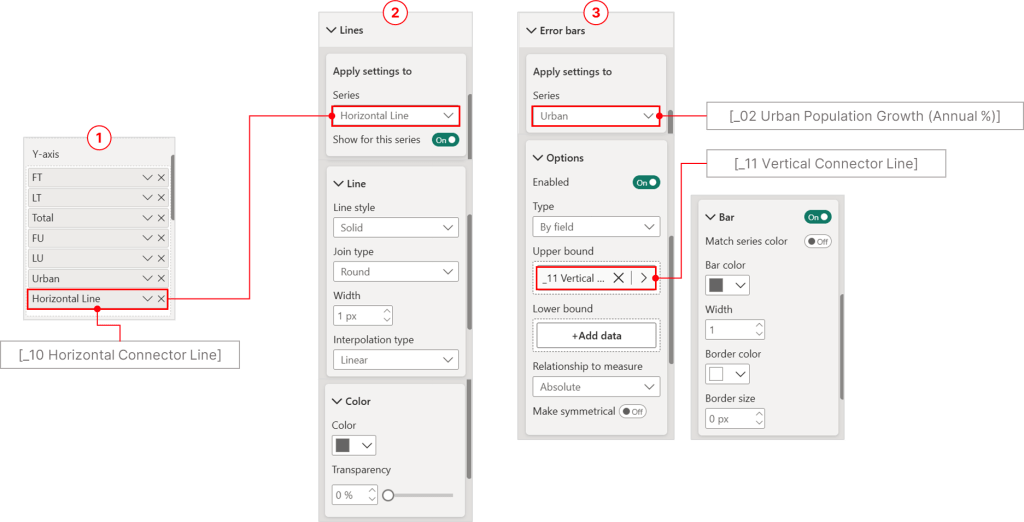
Step 2.3: Constructing Horizontal and Vertical Connector Lines

The next is to display growth over time on the lines. This value will dynamically change based on the year slider selection, showing growth between the earliest and latest selected years. First, create the horizontal connector line using this DAX measure:
Measure #09: [_09 Y-Axis Extra Space]
_09 Y-Axis Extra Space = [Highest_Urban Population Growth (annual %)] * 1.2This measure functions similarly to the previously defined [_04 Y-Axis Max] measure, and is used to establish the maximum height of the horizontal connector line. The following DAX measure creates a horizontal line at a specified height (_maxHeight) only for the years that are currently visible on the line chart.
Measure #10: [_10 Horizontal Connector Line]
_10 Horizontal Connector Line =
VAR _maxHeight = [_09 Y-Axis Extra Space]
VAR _currentYear = SELECTEDVALUE(YearTable[Year])
VAR _firstYearViz =
    CALCULATE(
        MIN(YearTable[Year]),
        ALLSELECTED(YearTable)
    )
VAR _lastYearViz =
    CALCULATE(
        MAX(YearTable[Year]),
        ALLSELECTED(YearTable)
    )
RETURN
IF(
    _currentYear >= _firstYearViz
        && _currentYear <= _lastYearViz,
        _maxHeight,
        BLANK()
)
Using the same approach, we will create a DAX measure for the vertical connector line that links the earliest and latest selected year markers with the horizontal connector line.
Measure #11: [_11 Vertical Connector Line]
_11 Vertical Connector Line =
VAR _ConnectorTop = [_09 Y-Axis Extra Space]
VAR _CurrentYear = SELECTEDVALUE(YearTable[Year])
VAR _FirstYearViz =
    CALCULATE(
        MIN(YearTable[Year]),
        ALLSELECTED(YearTable)
    )
VAR _LastYearViz =
    CALCULATE(
        MAX(YearTable[Year]),
        ALLSELECTED(YearTable)
    )
RETURN
IF(
    _CurrentYear = _FirstYearViz || _CurrentYear = _LastYearViz,
    _ConnectorTop,
    BLANK()
)
Add the [_10 Horizontal Connector Line] measure to the y-axis of the line chart and assign the [_11 Vertical Connector Line] measure to the upper bound of error bars for the [_02 Urban Population Growth (Annual %)] measure.
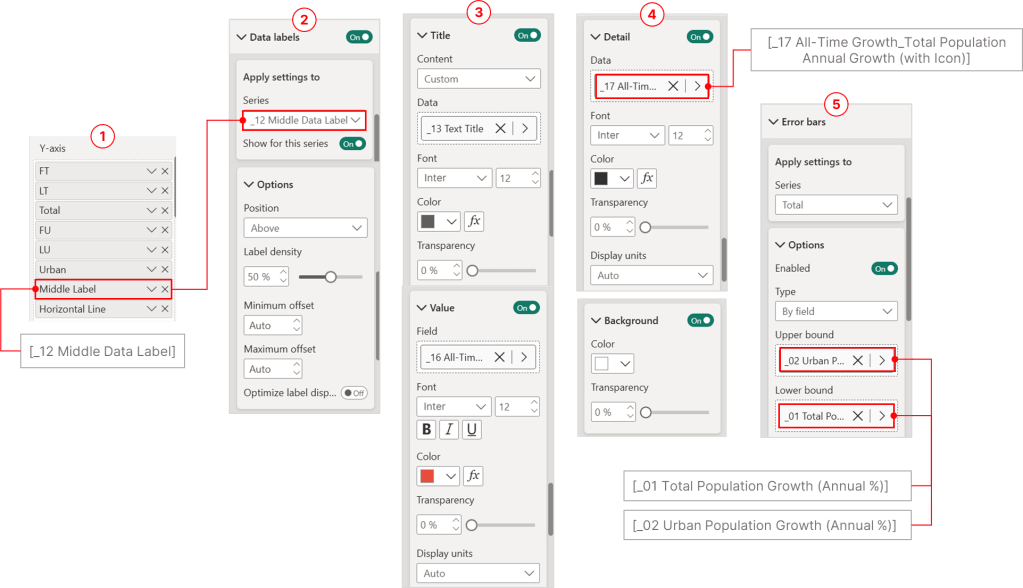
Step 2.4: Displaying Growth Over Time
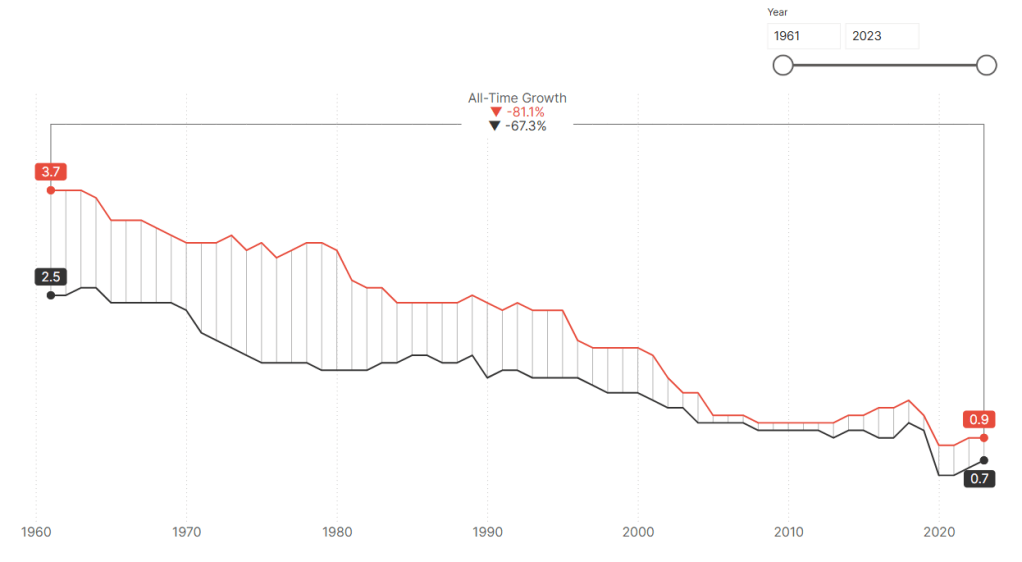
The concluding step involves adding a data label at the center of the horizontal connector line to represent growth over time. Initially, define a DAX measure to establish a marker as a positioning reference for the growth over time data label.
Measure #12: [_12 Middle Data Label]
_12 Middle Data Label =
VAR _maxHeight = [_09 Y-Axis Extra Space]
VAR _currentYMNum = SELECTEDVALUE(YearTable[Year])

// Create a table containing all distinct Year values in the selected range
VAR _tableofVisible =
    SUMMARIZE(
        ALLSELECTED(YearTable),
        YearTable[Year]
    )

// Add a ranking column to _tableofVisible, ranking Years in ascending order
VAR _tablewithRank =
    ADDCOLUMNS(
        _tableofVisible,
        "@Rank",
        RANKX(
            _tableofVisible,
            YearTable[Year], // Ranking value (Year)
            YearTable[Year], // Sorting Year in ascending order
            ASC,
            Dense            // Use dense ranking (no gaps in ranking)
        )
    )

// Determine the minimum and maximum ranks within the selection
VAR _minRank = MINX(_tablewithRank, [@Rank])
VAR _maxRank = MAXX(_tablewithRank, [@Rank])

// Compute the middle rank by averaging min and max ranks
VAR _midRank = DIVIDE(_minRank + _maxRank, 2)

// Round down the middle rank to get the closest integer position
VAR _roundedMid = ROUNDDOWN(_midRank, 0)

// Find the rank of the currently selected year
VAR _myRank =
    MAXX(
        FILTER(
            _tablewithRank,
            YearTable[Year] = _currentYMNum // Filter to get the rank of selected year
        ),
        [@Rank]
    )

RETURN

// If the current year rank is close to the middle rank, return _maxHeight, otherwise return BLANK()
IF(
    ABS(_myRank - _roundedMid) <= 0.5, //Allow a small tolerance (0.5) to ensure exact middle selection
    _maxHeight, // Place the middle label at max height
    BLANK()     // Otherwise, do not display the label
)
The formula calculates the middle year within the visible range of years on a line chart. It then displays a label at a specified vertical position only for the year that is closest to the calculated middle year. This dynamic label placement ensures that the label always appears at the center of the visible year range, regardless of the selected years.
1. Variable Declarations:
VAR _maxHeight = [_09 Y-Axis Extra Space]:- Assigns the value from the
[_09 Y-Axis Extra Space]measure to_maxHeight. This is the vertical position where the label will be placed.
- Assigns the value from the
VAR _currentYMNum = SELECTEDVALUE(YearTable[Year]):- Retrieves the single currently selected year from the
YearTable[Year]column.
- Retrieves the single currently selected year from the
2. Table Creation and Ranking:
VAR _tableofVisible = SUMMARIZE(ALLSELECTED(YearTable), YearTable[Year]):- Creates a table (
_tableofVisible) containing all the distinct year values that are currently visible in the visualization.ALLSELECTEDensures that any filters on theYearTableare ignored, but slicers and other outside filters are still respected.
- Creates a table (
VAR _tablewithRank = ADDCOLUMNS(_tableofVisible, "@Rank", RANKX(_tableofVisible, YearTable[Year], YearTable[Year], ASC, Dense)):- Adds a column named
@Rankto_tableofVisible. RANKXassigns a rank to each year based on its value.- The years are ranked in ascending order (
ASC). Denseranking ensures that ranks are consecutive (no gaps).
- Adds a column named
3. Rank Calculations:
VAR _minRank = MINX(_tablewithRank, [@Rank]):- Finds the minimum rank (the rank of the earliest visible year).
VAR _maxRank = MAXX(_tablewithRank, [@Rank]):- Finds the maximum rank (the rank of the latest visible year).
VAR _midRank = DIVIDE(_minRank + _maxRank, 2):- Calculates the average of the minimum and maximum ranks, which represents the middle rank.
VAR _roundedMid = ROUNDDOWN(_midRank, 0):- Rounds the
_midRankdown to the nearest whole number. This is done because ranks are integers.
- Rounds the
VAR _myRank = MAXX(FILTER(_tablewithRank, YearTable[Year] = _currentYMNum), [@Rank]):- Finds the rank of the currently selected year (
_currentYMNum) by filtering the_tablewithRanktable.
- Finds the rank of the currently selected year (
4. Return Logic:
RETURN IF(ABS(_myRank - _roundedMid) <= 0.5, _maxHeight, BLANK()):- This
IFstatement determines whether to display the label. ABS(_myRank - _roundedMid) <= 0.5: This condition checks if the rank of the currently selected year (_myRank) is within 0.5 of the rounded middle rank (_roundedMid). TheABSfunction ensures that the difference is always positive. This tolerance allows the label to show even if the middle rank isn’t a perfect integer._maxHeight: If the condition is true, the formula returns_maxHeight, placing the label at the designated vertical position.BLANK(): If the condition is false, the formula returnsBLANK(), meaning no label is displayed.
- This
After creating a DAX measure to position a marker at the center of the horizontal connector line for the growth over time data label, we will now define DAX measures that calculate growth over time for both total and urban population growth, along with displaying a title for the data label.
Measure #13: [_13 Text Title]
_13 Text Title = "All-Time Growth"This measure displays the text title for the data label.
Measure #14: [_14 Total Population_All-Time Annual Growth]
_14 Total Population_All-Time Annual Growth =
VAR _FirstYear =
    CALCULATE(
        MIN(YearTable[Year]),
        ALLSELECTED(YearTable)
    )

VAR _LastYear =
    CALCULATE(
        MAX(YearTable[Year]),
        ALLSELECTED(YearTable)
    )

VAR _FirstYearGrowth =
    CALCULATE(
        [_Total Population growth (annual %)],
        YearTable[Year] = _FirstYear
    ) / 100  -- Convert percentage to decimal

VAR _LastYearGrowth =
    CALCULATE(
        [_Total Population growth (annual %)],
        YearTable[Year] = _LastYear
    ) / 100  -- Convert percentage to decimal

VAR _Years = _LastYear - _FirstYear  -- Total years in range

VAR _GrowthFactor = ((1 + _LastYearGrowth) / (1 + _FirstYearGrowth)) ^ _Years - 1

RETURN
IF(NOT(ISBLANK(_FirstYearGrowth)) && NOT(ISBLANK(_LastYearGrowth)), _GrowthFactor, BLANK())
Measure #15: [_15 Urban Population_All-Time Annual Growth]
_15 Urban Population_All-Time Annual Growth =
VAR _FirstYear =
    CALCULATE(
        MIN(YearTable[Year]),
        ALLSELECTED(YearTable)
    )

VAR _LastYear =
    CALCULATE(
        MAX(YearTable[Year]),
        ALLSELECTED(YearTable)
    )

VAR _FirstYearGrowth =
    CALCULATE(
        [_02 Urban Population Growth (Annual %)],
        YearTable[Year] = _FirstYear
    ) / 100  -- Convert percentage to decimal

VAR _LastYearGrowth =
    CALCULATE(
        [_02 Urban Population Growth (Annual %)],
        YearTable[Year] = _LastYear
    ) / 100  -- Convert percentage to decimal

VAR _Years = _LastYear - _FirstYear  -- Total years in range

VAR _GrowthFactor = ((1 + _LastYearGrowth) / (1 + _FirstYearGrowth)) ^ _Years - 1

RETURN
IF(NOT(ISBLANK(_FirstYearGrowth)) && NOT(ISBLANK(_LastYearGrowth)), _GrowthFactor, BLANK())
Measure #16: [_16 All-TimeGrowth_Urban Population Annual Growth (with Icon)]
_16 All-Time Growth_Urban Population Annual Growth (with Icon) =
VAR YoYChange = [_15 Urban Population_All-Time Annual Growth]
RETURN
    IF(
        ISBLANK(YoYChange),
        "--",
        IF(
            YoYChange < 0,
            "▼ " & FORMAT(YoYChange, "0.0%"),
            "▲ " & FORMAT(YoYChange, "0.0%")
        )
    )
Measure #17: [_17 All-Time Growth_Total Population Annual Growth (with Icon)]
_17 All-Time Growth_Total Population Annual Growth (with Icon) =
VAR YoYChange = [_14 Total Population_All-Time Annual Growth]
RETURN
    IF(
        ISBLANK(YoYChange),
        "--",
        IF(
            YoYChange < 0,
            "▼ " & FORMAT(YoYChange, "0.0%"),
            "▲ " & FORMAT(YoYChange, "0.0%")
        )
    )
Thank you for reading!
I hope this case study provided valuable insights and sparked your interest. Please feel free to connect with me on LinkedIn or via email if you have any questions or would like to discuss this further.

Leave a comment